이번 포스팅에서는 CentOS 환경에서 VM 템플릿을 활용한 효율적인 인프라 배포부터 시작하여, 현대 모니터링의 표준이라 불리는 두 가지 조합인 [Telegraf + InfluxDB + Grafana] 와 [Prometheus + Node Exporter + Grafana] 시스템을 직접 구축해 보자.
[Telegraf + InfluxDB + Grafana]
1. 수집 - Telegraf
어떤 서버의 어떤 리소스(CPU, RAM, 스토리 입출력... 등 내가 원하는 대부분의 리소스의 상태, 사용량)를 얼마의 간격으로 수집할지 결정.
2. 저장 - InfluxDB
시계열(tme-series) DB, 일정한 시간 간격으로 수집된 데이터를 DB에 저장.
3. 시각화 - Grafana
저장된 데이터를 토대로 그래프를 그리거나 수치를 표현
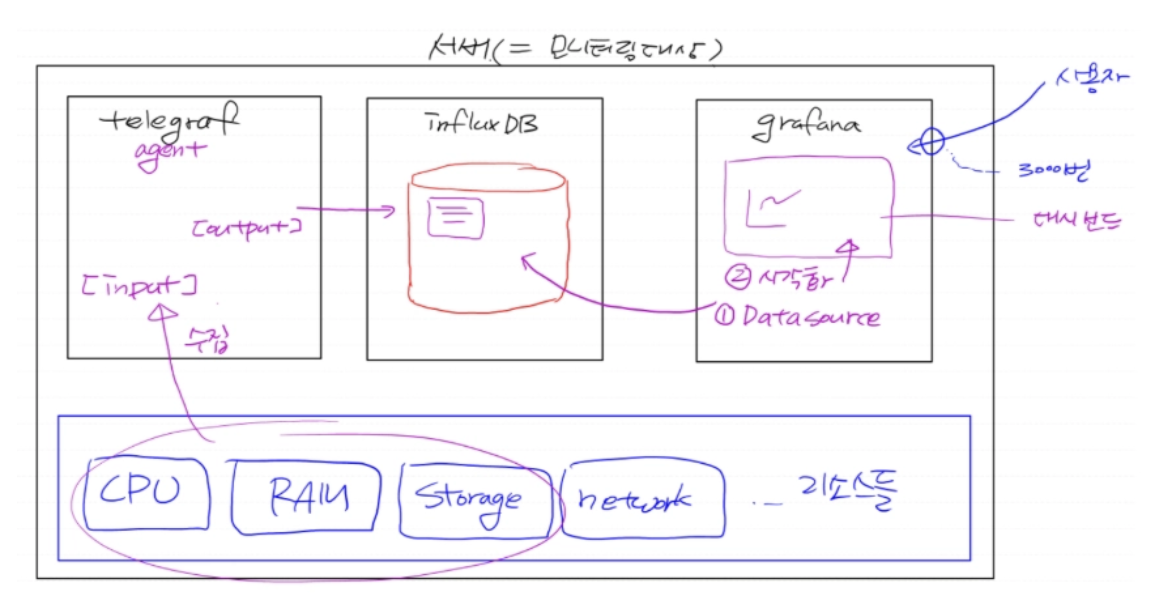
구성하고자 하는 모니터링 구성 흐름.
모니터링하고자 하는 서버에는 agent가 설치되어있어야 한다.
1. 모니터링 대상 서버에 설치된 Telegraf(agent)가 자료를 수집(input)
2. 수집한 자료를 output을 통해 InfluxDB에 저장시킨다.
3. 저장된 데이터 소스를 Grafana가 가져와서 시각화(Dashboard) 한다.
1. Telegraf
- Telegraf 및 InfluxDB 설치를 위한 레포 추가
cat <<EOF | tee /etc/yum.repos.d/influxdb.repo
[influxdb]
name = InfluxDB Repository - RHEL \$releasever
baseurl = https://repos.influxdata.com/rhel/\$releasever/\$basearch/stable
enabled = 1
gpgcheck = 0
gpgkey = https://repos.influxdata.com/influxdb.key
EOF
* tea 명령은 cat이랑 결과물은 동일하나 한 번 더 출력해주는 명령이다.
yum install -y telegrafTelegraf 먼저 설치해준다.
vi /etc/telegraf/telegraf.confTelegraf 설정 파일.
"어떻게 수집할지" 와 "어떻게 저장할지"를 설정.
telegraf.conf 에 넣을 내용
[global_tags]

# Configuration for telegraf agent
[agent]
    interval = "10s"
    debug = false
    hostname = "server-hostname"
    round_interval = true
    flush_interval = "10s"
    flush_jitter = "0s"
    collection_jitter = "0s"
    metric_batch_size = 1000
    metric_buffer_limit = 10000
    quiet = false
    logfile = ""
    omit_hostname = false

###############################################################################
#                                  OUTPUTS                                    #
###############################################################################

[[outputs.influxdb]]
    urls = ["http://localhost:8086"] # InfluxDB가 설치된 서버의 IP를
    database = "telegraf" # 데이터베에스 이름, 생성이 되어있지 않으면 자동 생성됨
    timeout = "10s"
    username = "admin" # InfluXDB 기본 계정
    password = "admin"
    retention_policy = ""

###############################################################################
#                                  INPUTS                                     #
###############################################################################

[[inputs.cpu]]
    percpu = true
    totalcpu = true
    collect_cpu_time = false
    report_active = false
[[inputs.disk]]
    ignore_fs = ["tmpfs", "devtmpfs", "devfs"]
[[inputs.diskio]]
[[inputs.mem]]
[[inputs.net]]
[[inputs.system]]
[[inputs.swap]]
[[inputs.netstat]]
[[inputs.processes]]
[[inputs.kernel]]
2. InfluxDB 설치
yum install -y influxdb-1.8.10InfluxDB를 설치한다.
InfluxDB의 기본 포트는 8086이다.
systemctl enable --now influxdb실행.

DB로 진입한다.
systemctl enable --now telegraf

Telegraf에서 output 된 자료들이 InfluxDB에 저장되는걸 확인 가능.
3. Grafana
cat <<EOF | tee /etc/yum.repos.d/grafana.repo
[grafana]
name=grafana
baseurl=https://packages.grafana.com/oss/rpm
repo_gpgcheck=1
enabled=1
gpgcheck=0
gpgkey=https://packages.grafana.com/gpg.key
sslverify=1
sslcacert=/etc/pki/tls/certs/ca-bundle.crt
EOF
grafana 설치 레포 추가.
yum install -y grafanagrafana를 설치한다.
grafana의 기본 포트는 3000번이다.
systemctl enable --now grafana-servergrafana 서버를 실행시킨다.

웹브라우저를 통해 접속하여 서버에 잘 설치되었는지 확인한다.
3000번 포트를 통해 서비스를 제공하고있다.

위에서 telegraf.conf 파일에 ID 와 Password 설정을 'admin'으로 했기 때문에 입력 후 로그인한다.
다음으로 시각화 할 Datasource 명시(InfluxDB)하고 Datasource의 형태에 맞는 Dashboard를 구성한다.
Dashboard는 보통 타인이 만들어 놓은 걸 import 한다.

Datasource 구성과 시각화
오른쪽에 DATA SOURCES 탭을 눌러 InfluxDB를 선택 후 구성한다.

현재 grafana와 InfluxDB는 같은 서버에 설치했기 때문에 localhost라고 해도 무방하다. 다만 포트는 당연히 InfluxDB의 포트를 명시해야 한다.

telegraf.conf 파일에서 설정했던 값을 입력해준다.
위 단계까지 진행했으면 아래에 Save & test 버튼을 눌러 테스트를 진행한다.
이제 대시보드를 세팅해보자.
다양한 대시보드들이 grafana.com에 존재한다.
ID만 copy 해서 import 해보자.


Import dashboard 를 눌러 대시보드 템플릿 ID인 928을 입력해 import 한다.
현재 대시보드상에 ${DS_INFLUXDB_TELEGRAF} 를 통해 datasource로 접근 가능하도록 환경변수가 구성된 상태지만, 실제 환경변수는 존재하지 않는다. 따라서 대시보드의 설정에서 환경변수를 추가해줘야 한다.

Dashboards 에 들어가 우측 상단에 Edit 버튼을 누르고 들어가 Settings를 눌러 대시보드를 설정한다.
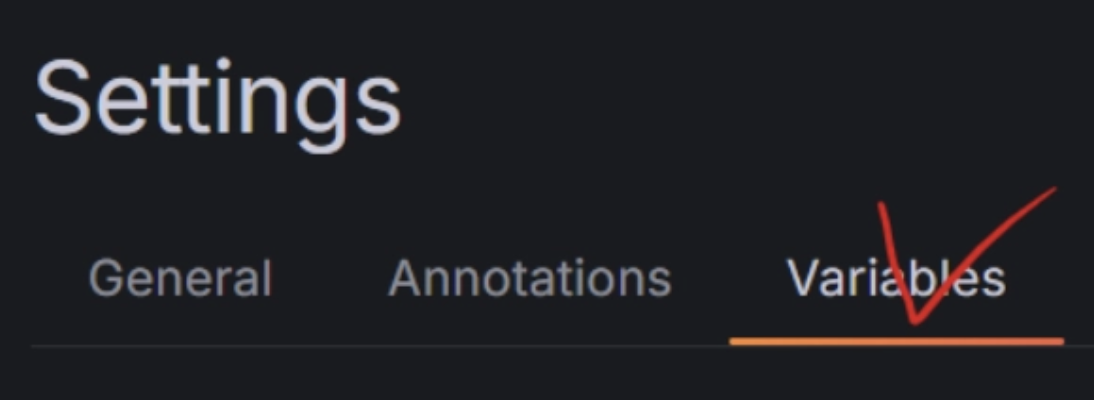
Variables 탭에서 New variable 버튼을 눌러 새로운 환경변수를 등록해준다.


환경변수 이름을 등록해주고, 이 환경변수가 가리키는 대상은 InfluxDB임을 등록해준다.
다 되었으면 우측 상단에 Save dashboard 버튼을 눌러 저장한다.

대시보드를 통해 CPU, RAM, 스토리 입출력 등 내가 원하는 대부분의 리소스의 상태, 사용량 정보를 확인할 수 있게 되었다.
---
[Prometheus + Node Exporter + Grafana]
리눅스 서버의 실시간 상태 정보를 자동으로 수집하고 저장하여 시각화하는 표준 오픈소스 모니터링 시스템 구축.
1. Node Exporter - 수집기 / agent
서버의 CPU 사용률, 남은 RAM 용량, 디스크 읽기/쓰기 속도 같은 로우(Raw) 데이터를 수집해서 9100번 포트에 텍스트 형태로 노출한다.
2. Prometheus - 저장소 / 서버
prometheus.yml 설정 파일에 등록된 대상(Node Exporter)를 주기적으로 방문하여 데이터를 긁어와 시계열 데이터베이스에 저장한다.
3. Grafana - 시각화
Prometheus에 저장된 복잡한 숫자 데이터를 가져와 그래프로 나타낸다.
1. Node Exporter 설치
wget [https://github.com/prometheus/node_exporter/releases/download/v1.7.0/node_exporter-1.7.0.linux-amd64.tar.gz](https://github.com/prometheus/node_exporter/releases/download/v1.7.0/node_exporter-1.7.0.linux-amd64.tar.gz)node exporter 압축 파일을 wget 명령으로 다운로드 한다.
압축을 풀 때와 할 때의 명령어를 간단히 적어주겠다.
tar -xvf
-x : extract(해제), v : 과정출력, -f : 파일
tar -cvf
-c : 압축 생성
tar -xvf node_exporter-1.7.0.linux-amd64.tar.gz다운로드 받은 node_exporter 파일을 압축 해제한다.

압축 해제 후 node_exporter-1.7.0.linux-amd64 경로로 들어가보면 초록색으로 node_exporter 파일이 생긴걸 볼 수 있다.
./node_exporter위 명령어로 실행시켜준다.

만약에 프로세스를 종료하고 싶다면, kill이나 pkill을 통해 종료시키면 된다.
pid 값은 그때그때 바뀐다.
curl [http://211.183.3.90:9100/metrics](http://211.183.3.90:9100/metrics)node exporter 가 잘 동작하는지 확인하려면 curl <주소> 명령을 통해 찍어보면 된다.
2. Prometheus 설치
**wget https://github.com/prometheus/prometheus/releases/download/v2.45.0/prometheus-2.45.0.linux-amd64.tar.gz**wget 명령으로 prometheus를 설치해준다.
tar -xvf prometheus-2.45.0.linux-amd64.tar.gznode exporter와 마찬가지로 tar -xvf 명령으로 압축을 해제한다.
vi prometheus.ymlvi 명령으로 prometheus.yml 파일에 들어가 모니터링 대상인 prometheus를 추가한다.

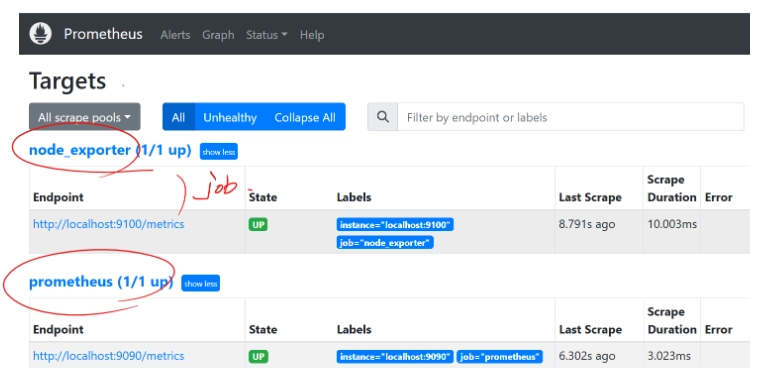
9100은 node_exporter 포트 번호이고, 9090은 prometheus 포트 번호다.
./prometheusprometheus를 실행해준다.
웹 브라우저에서 http://211.183.3.90:9090/targets 경로로 접속해 잘 동작하는지 테스트해본다.
3. Grafana
cat <<EOF | tee /etc/yum.repos.d/grafana.repo
[grafana]
name=grafana
baseurl=https://packages.grafana.com/oss/rpm
repo_gpgcheck=1
enabled=1
gpgcheck=0
gpgkey=https://packages.grafana.com/gpg.key
sslverify=1
sslcacert=/etc/pki/tls/certs/ca-bundle.crt
EOF
grafana 설치를 위해 레포를 추가한다.
yum install -y grafanagrafana 설치.
**systemctl restart grafana-server**
**systemctl enable grafana-server**
grafana-server 실행.

위에서 했던 설정과 같이 admin 을 통해 접속한다.
위에서는 InfluxDB를 통해 구성했다면, 이번엔 Prometheus를 구성할 것이다.

URL을 입력해주고 Save & test를 눌러 저장한다.
이번엔 dashboard ID 1860을 입력해 import 해줄 것이다.


대시보드가 잘 세팅된 것을 확인할 수 있다.
---
추가로 'Daemon (데몬)' 을 만드는 법을 알아보자.
왜 굳이 데몬으로 만드냐하면,
일반 실행 파일은 실행한 사용자가 터미널 창을 닫거나 로그아웃하면 함께 종료된다. 24시간 모니터링을 해야 하는 Prometheus가 사용자 접속이 끊겼을 경우 모니터링도 함께 종료되면 안되기 때문이다.
데몬으로 만들면 사용자 접속 여부와 상관없이 시스템이 켜져 있는 한 계속 동작한다.
위에서 보면 systemctl enable 명령을 사용했었다. 이 명령은 부팅 시 자동 실행을 설정하는 것이다. 정전이나 점검 등으로 서버가 재부팅되었을 때 일일이 접속해서 ./prometheus를 입력할 필요 없이 OS가 알아서 서비스를 올리게 된다.
일반적인 실행 파일을 데몬으로 만드는 법은 systemd에 등록해주고 daemon reload를 해주면 된다.
node_exporter 와 prometheus를 데몬으로 만들어보자.
먼저 node_exporter를 데몬으로 만들어보자.
cat <<EOF | tee /etc/systemd/system/node_exporter.service
[Unit]
Description=Node Exporter
Wants=network-online.target
After=network-online.target

[Service]
Type=simple
ExecStart=/root/node_exporter-1.7.0.linux-amd64/node_exporter
# 실행할 대상 파일.
[Install]
WantedBy=multi-user.target
EOF
systemd에 데몬 파일(/etc/systemd/system/node_exporter.service)을 생성한다.
node_exporter가 데몬의 이름이 될 것이다.
systemctl daemon-reload변경 사항을 반영하면 정상적으로 작동할 것이다.
prometheus도 데몬으로 만들어보자.
cat <<EOF | tee /etc/systemd/system/prometheus.service

[Unit]
Description=Prometheus
Wants=network-online.target
After=network-online.target

[Service]
Type=simple

ExecStart=/root/prometheus-2.45.0.linux-amd64/prometheus \
    --config.file=/root/prometheus-2.45.0.linux-amd64/prometheus.yml \
    --storage.tsdb.path=/root/prometheus-2.45.0.linux-amd64/data
# 실행파일 및 설정파일도 등록

[Install]
WantedBy=multi-user.target
EOF
추가 후
systemctl daemon-reload
systemctl enable --now prometheus
변경 사항을 반영해주고 enable 시켜준다.
'Infra > 네트워크' 카테고리의 다른 글
| 3 Tier Architecture 구성하기 (feat. VMware, xshell, GNS3) (0) | 2026.03.08 |
|---|